On-chain Data Academy (Part 5): How Many People Are Actually Making Money? A Five-Minute Overview of the Objective Sentiment Indicator PSIP


Original Article Title: "On-Chain Data Classroom (Part 5): How Many People Are Actually Making Money? A Five-Minute Guide to the Objective Sentiment Indicator PSIP!"
Original Article Author: Mr. Berg, On-Chain Data Analyst
This article is the 5th part of the On-Chain Data Classroom series, with a total of 10 parts. It will take you step by step through understanding on-chain data analysis. Interested readers are welcome to follow this series.
Related Reading: "On-Chain Data Classroom (Part 4): Visualized BTC Chip Price Distribution Chart"
TL;DR
- This article will introduce the on-chain indicator PSIP
- PSIP = Percentage of Supply in Profit, among circulating $BTC
- It can serve as a guide to market sentiment, with applications in recognizing market tops and bottoms
What is PSIP?
PSIP, short for Percent Supply in Profit, is defined as "the percentage of circulating $BTC that is in a state of profit."
Calculation method:
It distinguishes profit and loss chips by "comparing each $BTC's last transfer price with the current price."
When the current price is higher than a certain $BTC's last transfer price, this $BTC is considered a profit chip.
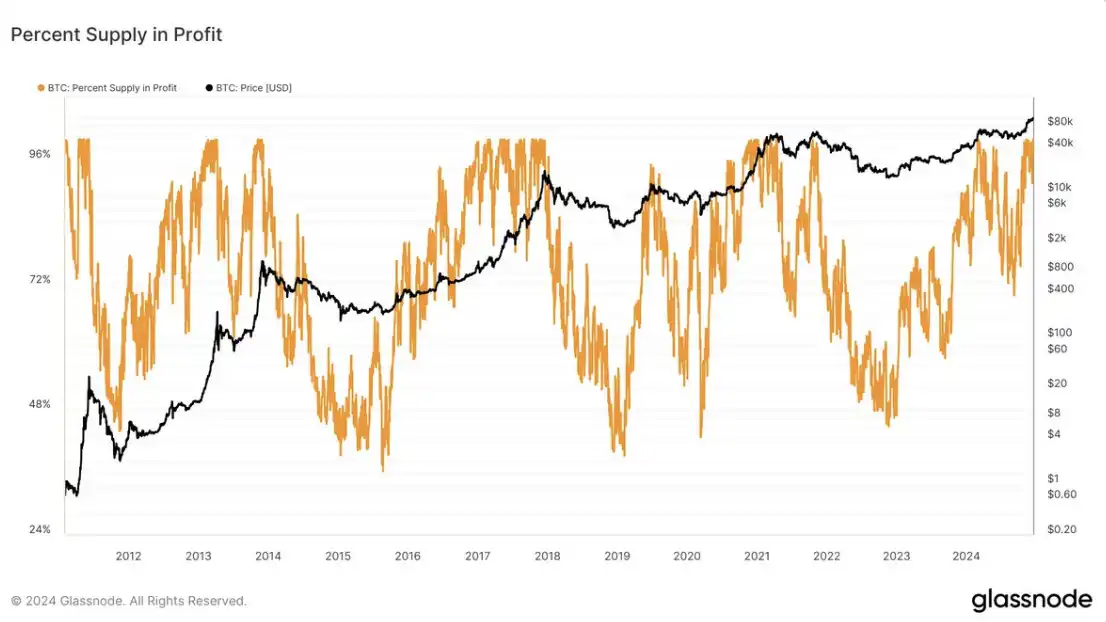
What if Most Chips Are in a Loss...?
An important application scenario of PSIP is market bottoms. When most chips are in a loss, it is usually a good time to buy the dip.
The logic is straightforward:
Under similar conditions, the more profitable holders, the greater the selling pressure from profit-taking in the market, and vice versa.
As shown in the chart below, historical points where $BTC had PSIP <50% are marked, indicating very precise opportunities to buy the dip

What if the Majority of Chips are in Profit?
As shown in the chart below, the percentage of chips in profit reaches a maximum value of 100%. Therefore, it is difficult to determine a top based solely on high PSIP.
Here is an interesting logic to share: “Observe the Correlation Change between PSIP and Price”
This idea is derived from the following analysis: The Market Pulse – Week 36, 2022

Conclusion
The above is all the content of On-Chain Data School (Part Five). For readers interested in further studying on-chain data analysis, remember to keep track of this series of articles!
If you want to see more analysis and teaching content on on-chain data, feel free to follow my Twitter account (X)!
I hope this article has been helpful to you. Thank you for reading.
You may also like

Raising interest rates to protect STRC and selling coins to maintain credit, this time the strategy has chosen the two most expensive paths
Morning Report | Samsung announces a 265.5 trillion won investment plan, focusing on semiconductor and AI computing power data centers; Vitalik publishes an article detailing the entire technology tree behind the confusion protocol (iO) mainline
In the era of AI, what is left of Bitcoin?
NeoSoul announced plans to integrate with the OKX Agentic Wallet, promoting AI agents' participation in the on-chain economy
Why Is Bitcoin Lagging Stocks in 2026? AI Stocks, ETF Outflows, and the Nasdaq Rally Explained
What you bought on CEX is really not US stocks: Analyzing the 94% liquidation monopoly and the evaporation of equity under a five-layer pipeline
In such a crowded cross-border payment arena, where is the next stop for the future?
Why Is Bitcoin Down in 2026? What We Can Learn From 2022
The large models in the United States are moving towards closure in the name of security
From the white-haired stock god to the billionaire fund mogul, the smart people shorting Nvidia are all getting rich using the same framework
Morning Report | CoinEx becomes a key hub for Iran to evade sanctions, involving over $3.8 billion in funds; Kalshi seeks a new round of financing, with a valuation potentially rising to $40 billion
Global Launch: As predictions become the most scarce asset in the AI era, Manadia is defining the next generation of the value internet
Why do cryptocurrency projects always like to change their names?
Who is footing the bill for the $64 billion accounting frenzy?
I never expected that the first application of AI x Crypto would be in security auditing
What is your view on Binance's competitive advantages?
ETH has entered a non-consensus phase, and the turning point is approaching!