On-Chain Data School (Part Four): Visualizing BTC UTXO Age Price Distribution Chart


Original Article Title: "On-chain Data Classroom (Part 4): Visualizing the $BTC Chip Price Distribution Chart "
Original Article Author: Mr. Berg, On-chain Data Analyst
This article is the 4th in the On-chain Data Classroom series, which consists of 10 articles in total. Take you step by step to understand on-chain data analysis. Interested readers are welcome to follow this series of articles.
Related Reading: "On-chain Data Classroom (Part 3): Have the Bottom Fishing Whales Taken Profit?"
TLDR
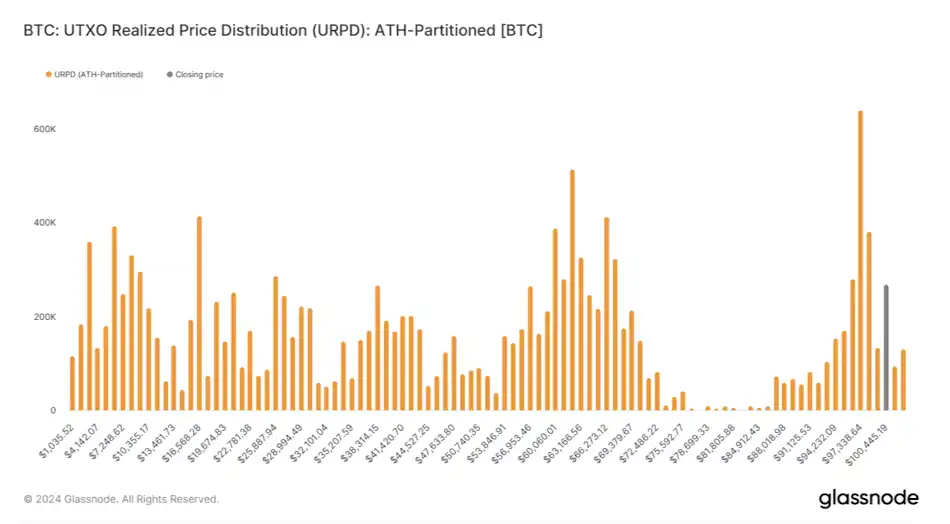
- This article will introduce the on-chain metric URPD
- URPD shows the distribution of $BTC chips at different holding costs
- URPD can be used to observe chip turnover, distribution conditions, and provide guidance on trends
What is URPD?
URPD, short for UTXO Realized Price Distribution.
Due to BTC's unique UTXO blockchain structure,
we can track data on-chain that is unavailable in traditional financial markets.
The URPD chart is an indicator derived from this principle,
where we can see the number of chips corresponding to each price level on the chart,
equivalent to showing the "buying cost of each $BTC."
URPD, Chip Turnover, Accumulation, and Distribution
After understanding the concept of URPD,
we can then observe the turnover of chips at different price levels based on the daily URPD changes.
For example:
Chart one below is the URPD chart for May 1,
while chart two is the URPD chart for October 1.
After experiencing five months of wide-ranging fluctuations in price,
It is quite obvious to see the phenomenon of low-cost chips being distributed upwards.

URPD, Chip Turnover, Accumulation, and Distribution (2)
In history, at a market top, it is usually accompanied by the tail end of high-profit low-cost chip distribution;
while at a market bottom, a large amount of chips can be seen accumulating in a relatively narrow range.
Therefore, in analysis,
URPD is often observed together with other data (such as realized profit, MVRV, etc.),
integrating logical thinking to understand the market from a more comprehensive perspective.

Support, Resistance, Consensus
When a significant amount of chips begins to accumulate in a single price range,
it indicates that a supply-demand consensus has gradually formed in that range.
Once the price later rapidly rises out of that range,
due to the high turnover of chips in that range,
it is likely to provide support in the future;
Conversely, if the price falls below that range,
the chips in that range will become trapped chips,
which may act as resistance levels in future price increases.
Conclusion
The above is all the content of On-Chain Data School (Part Four). For readers interested in delving deeper into on-chain data analysis, remember to keep track of this series of articles!
If you want to see more analysis and educational content on on-chain data, feel free to follow my Twitter handle (X)!
Hope this article has been helpful to you. Thank you for reading.
You may also like

In the era of AI, what is left of Bitcoin?
NeoSoul announced plans to integrate with the OKX Agentic Wallet, promoting AI agents' participation in the on-chain economy
Raising interest rates to protect STRC and selling coins to maintain credit, this time the strategy has chosen the two most expensive paths
Why Is Bitcoin Lagging Stocks in 2026? AI Stocks, ETF Outflows, and the Nasdaq Rally Explained
Morning Report | Samsung announces a 265.5 trillion won investment plan, focusing on semiconductor and AI computing power data centers; Vitalik publishes an article detailing the entire technology tree behind the confusion protocol (iO) mainline
What you bought on CEX is really not US stocks: Analyzing the 94% liquidation monopoly and the evaporation of equity under a five-layer pipeline
In such a crowded cross-border payment arena, where is the next stop for the future?
Why Is Bitcoin Down in 2026? What We Can Learn From 2022
The large models in the United States are moving towards closure in the name of security
From the white-haired stock god to the billionaire fund mogul, the smart people shorting Nvidia are all getting rich using the same framework
Morning Report | CoinEx becomes a key hub for Iran to evade sanctions, involving over $3.8 billion in funds; Kalshi seeks a new round of financing, with a valuation potentially rising to $40 billion
Global Launch: As predictions become the most scarce asset in the AI era, Manadia is defining the next generation of the value internet
Why do cryptocurrency projects always like to change their names?
Who is footing the bill for the $64 billion accounting frenzy?
I never expected that the first application of AI x Crypto would be in security auditing
What is your view on Binance's competitive advantages?
ETH has entered a non-consensus phase, and the turning point is approaching!